
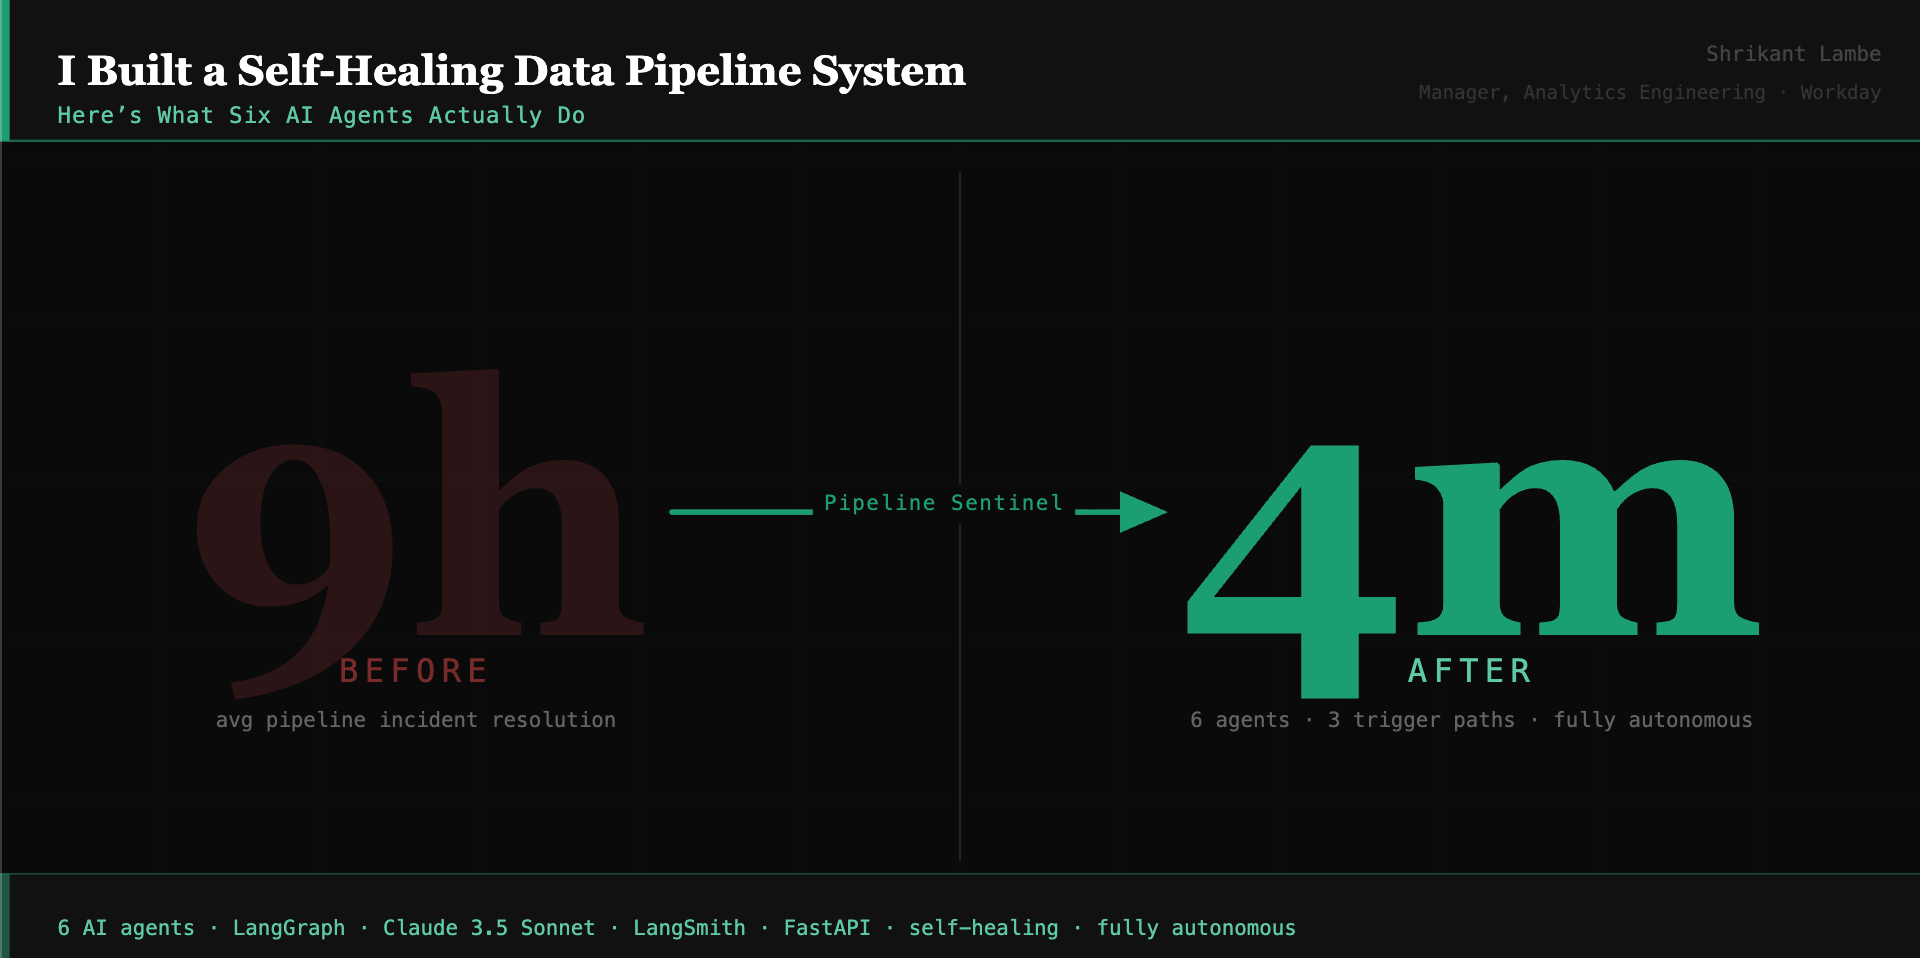
Agentic Data Infrastructure: I Built a Self-Healing Data Pipeline System.
Here's What Five AI Agents Actually Do.

Every data engineering team has the same problem: pipelines fails in ways that are invisible until they aren’t.
Not a crashed DAG with a red Airflow tile. The harder kind. A pipeline that completes successfully - technically - but with a freshness timestamp that’s wrong. A schema change upstream that no one caught because the pipeline didn’t fail, it just silently started producing incorrect data. An incident that starts as a Slack message and ends as a two-day, multi-team recovery with a JIRA ticket that documents what happened just well enough to feel like progress - but not enough to prevent the next one.
I managed teams dealing with this for years. Manual log-digging, cross-team coordination, no consistent playbook, no institutional memory. The same failure patterns repeating on a six-month cycle.
So I asked myself:
What if the system could handle most of that itself?Not just alert on failures. Actually watch pipelines continuously on its own, diagnose root cause when something goes wrong, assess downstream impact before touching anything, attempt a fix, retry with a different strategy if needed, verify the fix worked, log every decision, and communicate what happened - all without anyone pressing a button.
That question became Pipeline Sentinel : a six-agent agentic system built with LangGraph, Claude 3.5 Sonnet, and Streamlit.
Big Question: Build vs Buy
Enterprise data observability platforms exist, and several are genuinely strong. For large organizations with dedicated platform teams and complex multi-system estates, they’re a reasonable investment.
But even the most capable platforms in this space share a structural limitation: they surface the problem and hand it back to a human. The newest generation of AI-powered observability tools provides enriched incident context and probable root causes - but stops short of executing fixes autonomously and closing the loop.
That gap between detecting a failure and autonomously resolving it - is what Pipeline Sentinel is built for.
There’s a second reason to build rather than buy: you learn things by building that configuring a vendor tool won’t teach you. When you have to design the logic that decides whether an AI agent should act or escalate, encode it explicitly, defend it, and test it - those decisions compound into every agentic system you build afterward.
What I Built
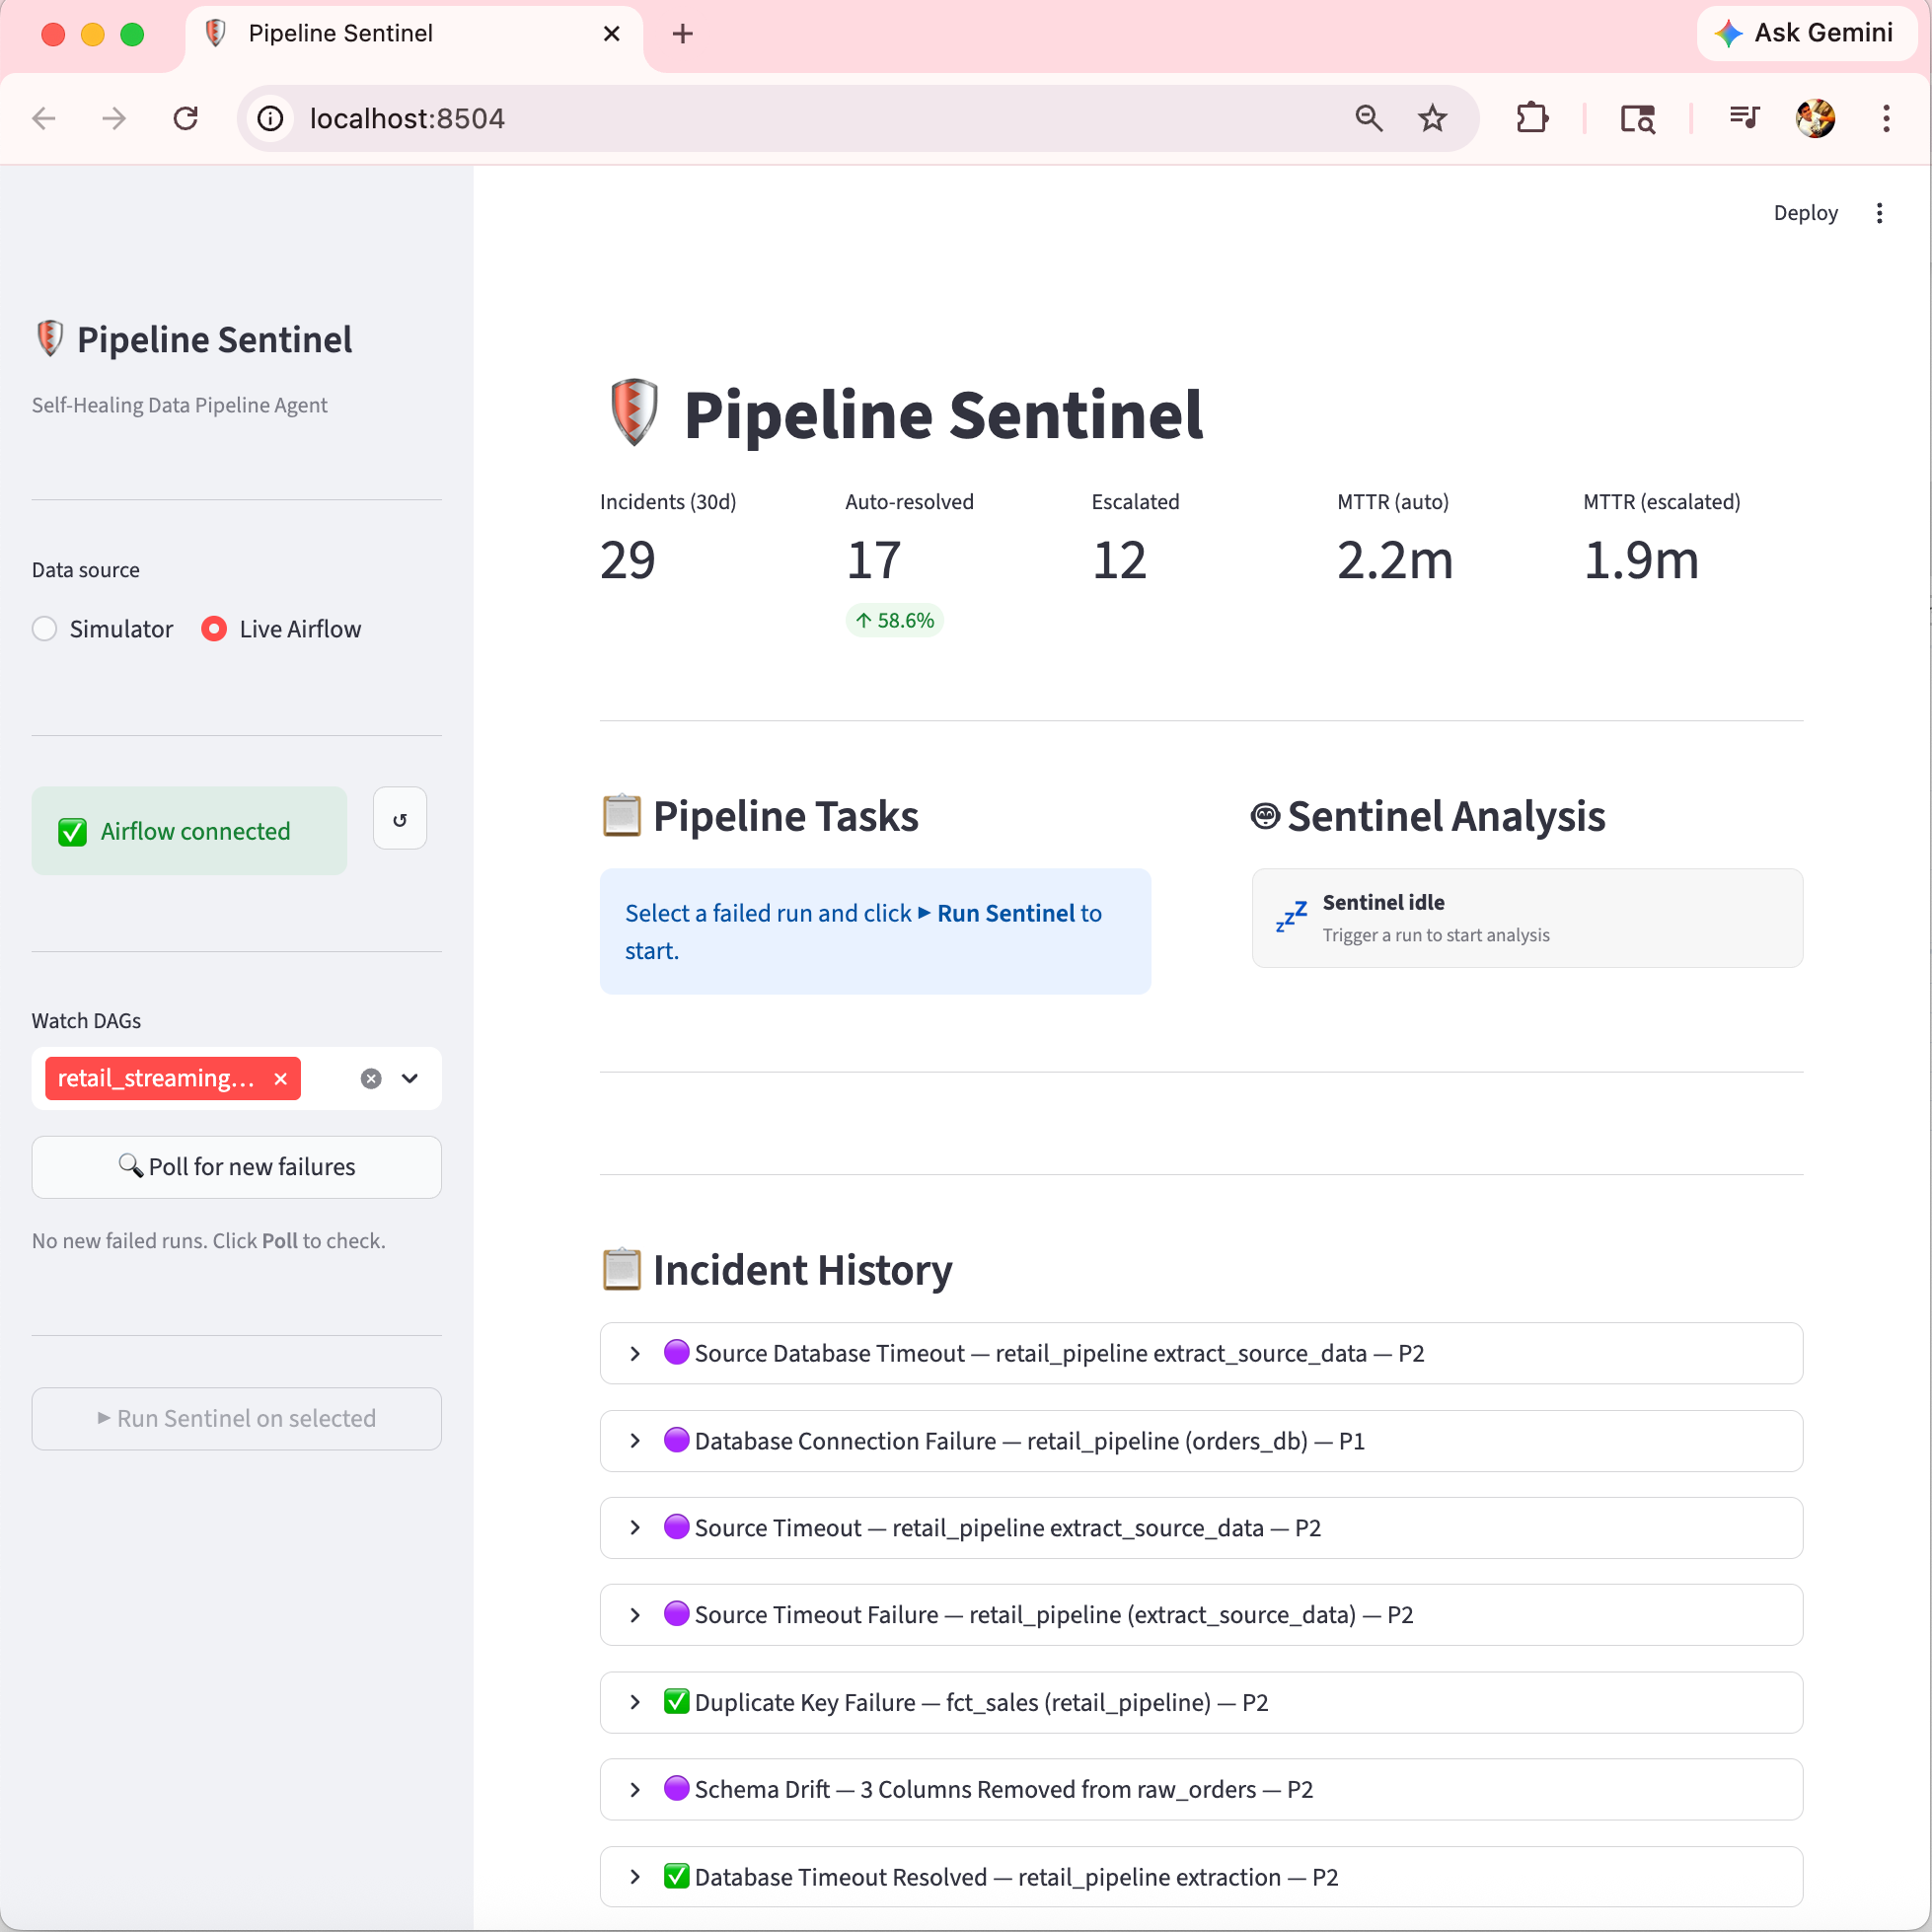
Here is how the streamlit UI looked like, since this was build in few days. I only considered handful of use-cases / connected to my local Airflow Instance to verify connectivity with one stand-alone streaming data pipeline running every 10 mins.
How it runs - three trigger paths
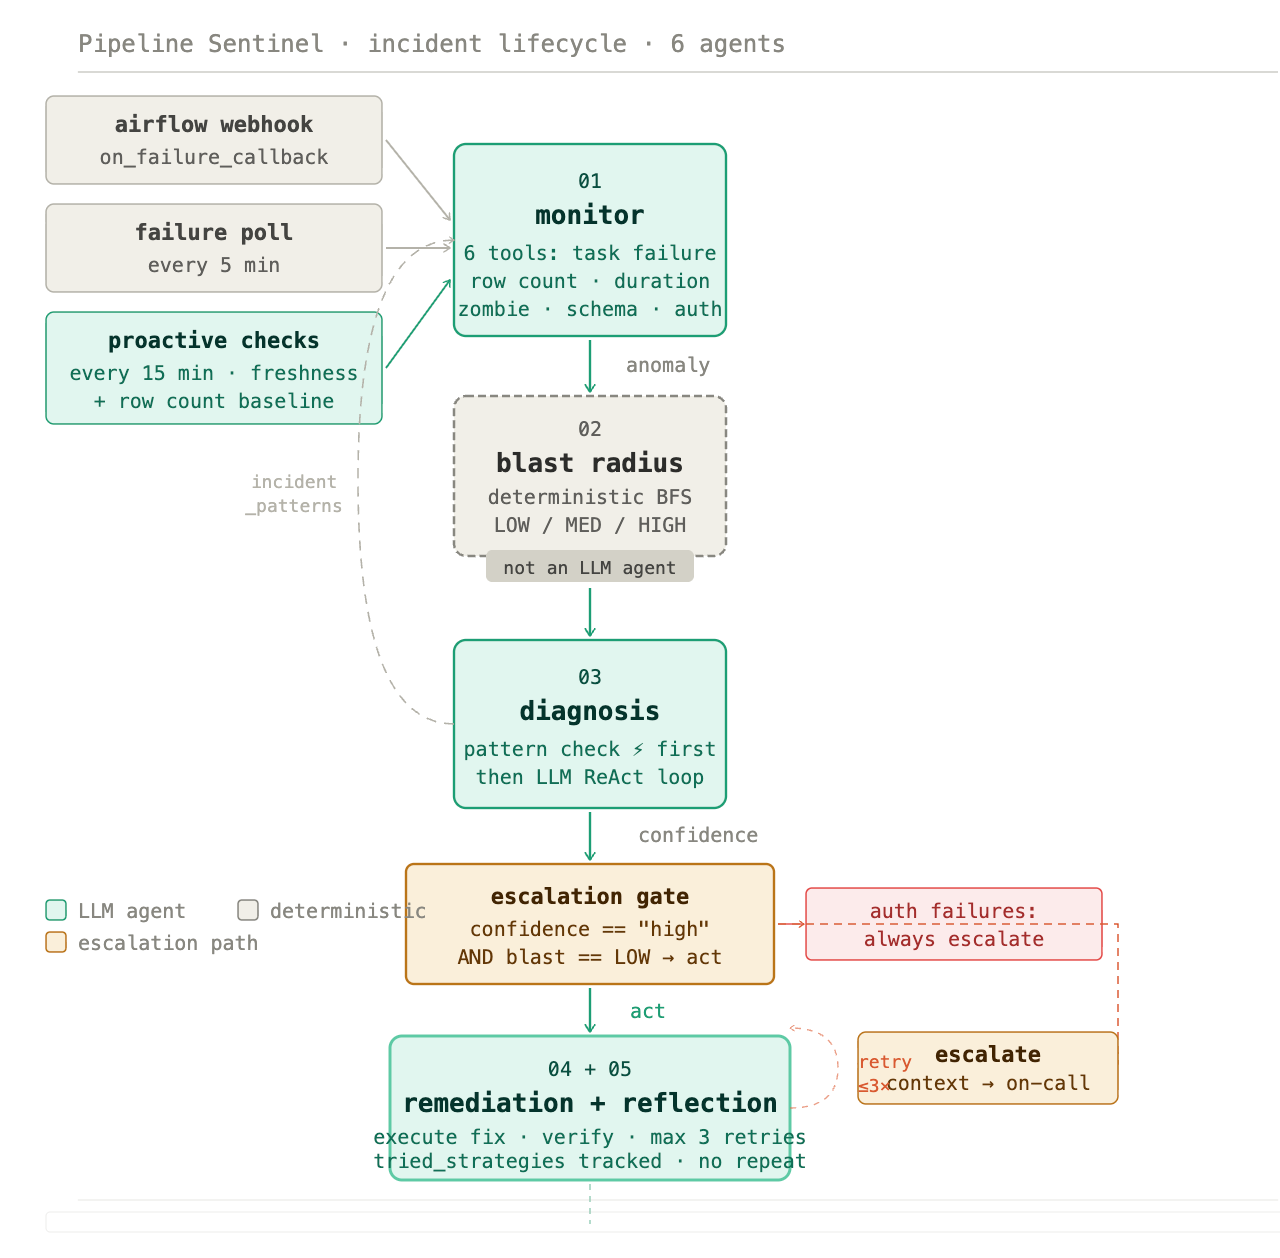
Pipeline Sentinel operates through a watcher module that runs without any human interaction across three distinct paths:
Airflow
on_failure_callback- a webhook fires the moment Airflow marks a run as failed, triggering the full agent pipeline immediatelyFailure poll every 5 minutes - the watcher queries Airflow for any failed runs it hasn’t processed yet, catching anything the webhook might have missed
Proactive checks every 15 minutes - the watcher independently checks pipeline freshness (has this DAG run successfully within the configured window?) and row count baselines (is the incoming data volume within expected range?). If either check fails, it synthesizes a run and fires the full agent chain - without waiting for Airflow to report anything
That third path is the one that catches the invisible failures. A pipeline can show green in Airflow while its data is quietly stale or short. The proactive checks surface those before any downstream consumer sees wrong numbers.
All three paths write to the same SQLite database and appear in the same Streamlit dashboard. The system also posts a formatted Slack alert on every completed incident - resolved and escalated alike - with severity, blast radius, MTTR, and any required action.
What six agents actually do
The architecture is a LangGraph state machine. Each step owns a specific cognitive task and passes structured context forward.
Monitor - six detection tools
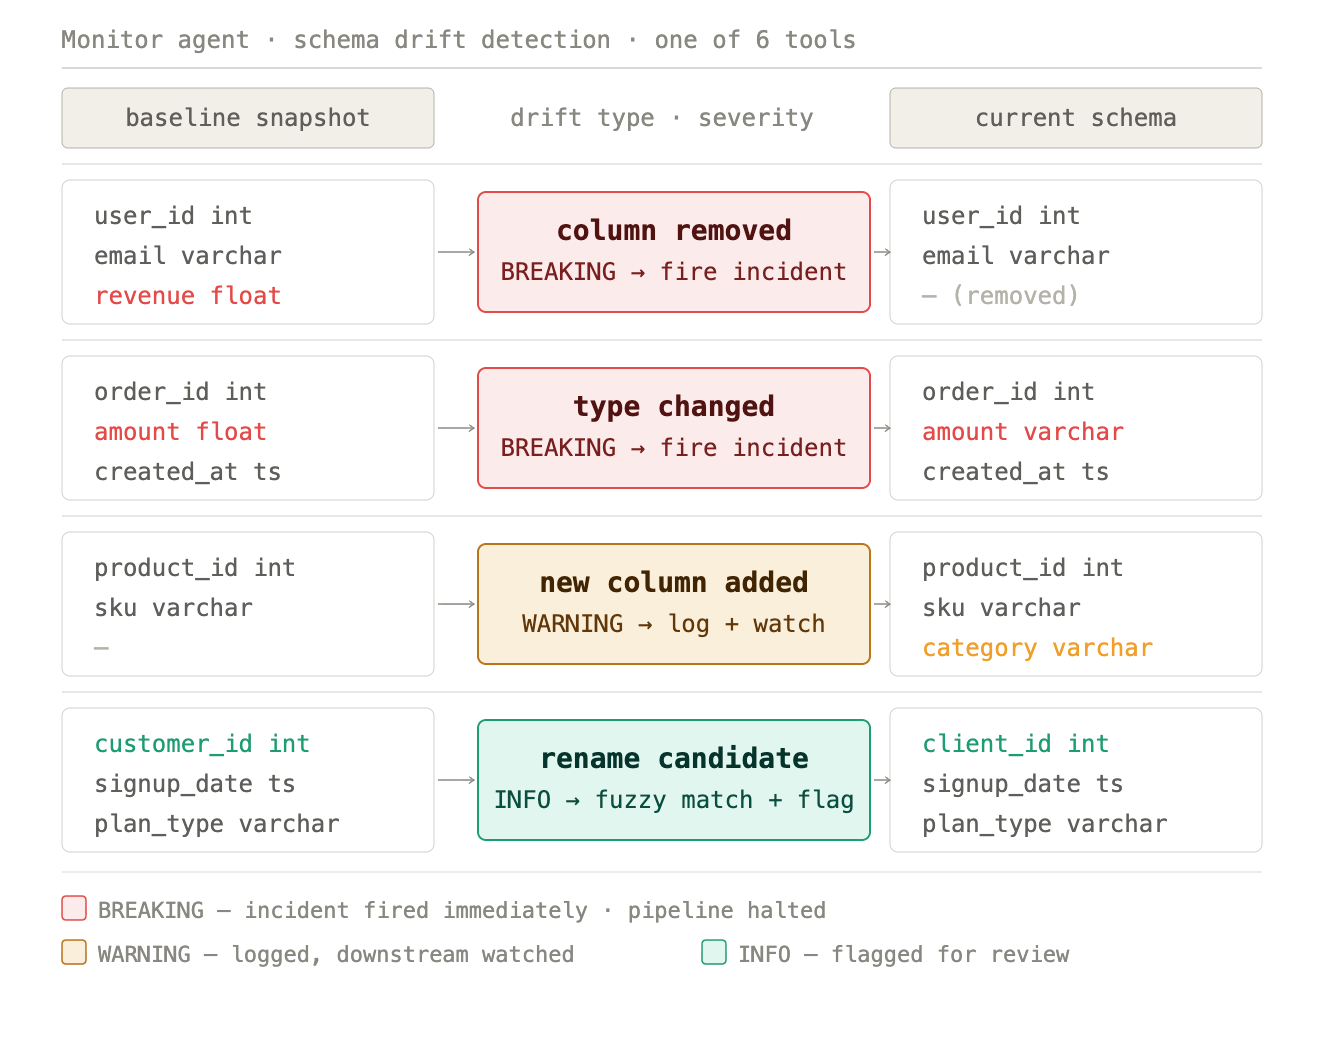
The Monitor runs a ReAct loop across six tools: task failure state, row count anomaly (default ±15% threshold vs. historical baseline), task duration anomaly (flags anything running more than 3× its baseline), zombie task detection (tasks stuck in running for more than 30 minutes), schema drift (column-level comparison against a registered baseline, classified as BREAKING, WARNING, or INFO), and auth failures.
Each tool call produces evidence. The Monitor reasons over that evidence and loops until it has enough to return a structured anomaly report. It never writes to the database - its only job is detection and reporting.
This breadth matters. A schema change that makes a pipeline lie is caught by the schema drift tool. A job that’s technically running but consuming 4× its normal time is caught by the duration anomaly tool. Both surface before downstream consumers see anything wrong.
Blast radius - deterministic, not LLM
This step is deliberate and important: blast radius assessment is not an LLM agent. It’s a deterministic breadth-first search over a dependency graph, scoring each failing task’s downstream impact as LOW, MEDIUM, or HIGH based on what lives downstream of it.
LOW means the failure is isolated to raw or staging layers with no high-impact consumers. MEDIUM means dbt mart models and reporting tables are affected. HIGH means executive dashboards, ML models, or SLA-bound reports are in the blast zone.
The reason this is deterministic is governance. You don’t want probabilistic reasoning deciding whether a fix is safe to apply automatically. The dependency graph is explicit, the BFS is exact, and the result is a hard categorical score that feeds directly into the escalation gate.
Diagnosis - with pattern memory fast-path
Before calling the LLM, Diagnosis checks a persistent incident_patterns table. If a pattern exists for this pipeline with occurrence_count ≥ 3 and success_rate ≥ 0.90, the agent returns the cached strategy immediately - no LLM call, shown as ⚡ in the dashboard.
If no qualifying pattern exists, the full ReAct loop runs: Claude 3.5 Sonnet reads the anomaly report, calls tools to gather additional evidence, reasons over the results, and returns a root cause with a remediation strategy and a confidence rating.
This is how the system gets smarter over time without retraining. Common, well-understood failures resolve faster on every repetition. Novel failures get the full reasoning treatment.
Escalation gate - one rule, no exceptions
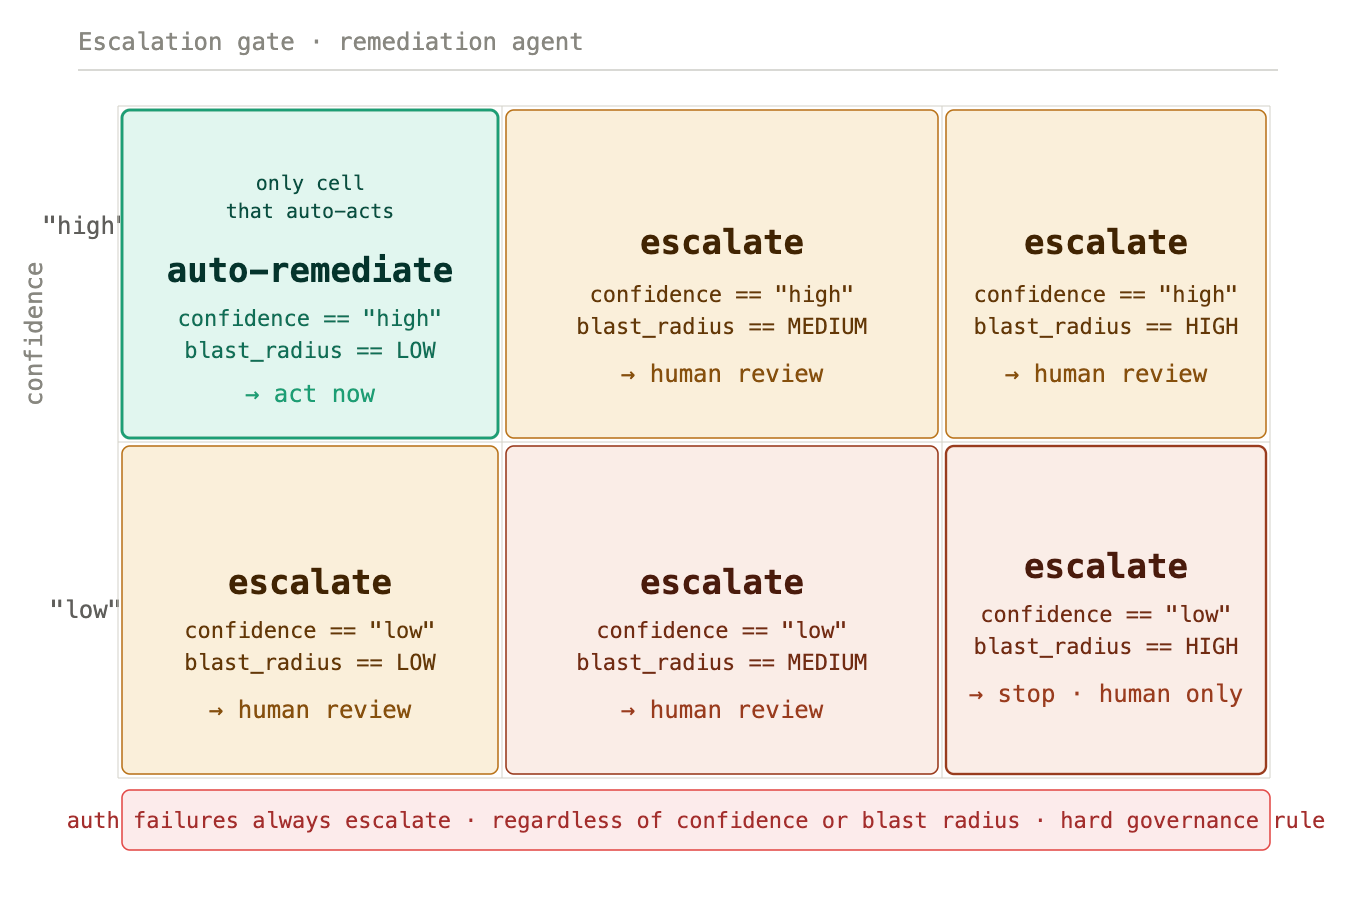
A single function: should_auto_remediate(confidence, blast_radius). The condition is exact - auto-remediation fires only when confidence == "high" AND blast_radius == "LOW". Any other combination escalates immediately and the Remediation agent never runs.
Auth failures always escalate regardless of confidence or blast radius. This is a hard governance decision, not a threshold. A credential problem is a security signal, and no automated system should be taking action on a potential auth breach without human review.
Human-in-the-loop isn’t a feature added for safety optics. The gate is the precise boundary that makes the rest of the system trustworthy.
Remediation and reflection - a retry loop, not a single attempt
When the gate approves action, Remediation executes exactly one fix per attempt, then immediately checks the result. If the pipeline is healthy, it passes to Reflection. If not, Reflection decides whether to retry with a different strategy or escalate.
The loop runs up to three attempts. Crucially, it tracks tried_strategies - it will never suggest a previously failed approach. Each retry uses a different canonical fix from the strategy set: retry_task, apply_dedup, reload_schema, extend_ingestion_window, run_dbt_full_refresh. If all viable strategies are exhausted without resolution, the system escalates with the full context of what was tried and why each attempt failed.
This retry-with-memory design is what separates the system from simple automation. It doesn’t just keep trying the same thing. It reasons about what hasn’t worked and adjusts.
Explanation - plain language for whoever needs to know
A single LLM call, no tools. Writes a 150–250 word incident narrative: what failed, why, what the blast radius was, what was done, how many attempts it took, what the outcome is, and whether any follow-up action is required. Sets severity as P1, P2, or P3.
This goes to the Slack alert, the dashboard verdict card, and wherever else the on-call engineer needs it. One less thing to write at 8 AM after a late-night incident that resolved itself.
Audit trail - every decision recorded
Every agent transition is written to a structured agent_audit_log table: agent name, timestamp, decision made, confidence rating, input and output state summary - all grouped by incident ID. The full decision chain for any incident is queryable with a single function call. Every automated action is explainable, traceable, and reversible.
Measuring whether it actually works
The Streamlit dashboard surfaces the KPIs that matter: total incidents over a rolling 30-day window, auto-resolved count and percentage, escalated count, and MTTR tracked separately for auto-resolved vs. escalated incidents. A daily trend chart shows whether the self-healing rate is improving over time.
The dashboard also streams the live thought process - every ReAct loop step, tool call, and observation from every agent in real time, plus a phase bar showing exactly where in the pipeline a given incident is. Resolved incidents keep a full reasoning replay so any decision can be reviewed after the fact.
The self-healing rate is the number that matters: not “we built an AI system” but “84% of incidents this month resolved autonomously, MTTR for those was 4.2 minutes.”
What it’s built with
LangGraph for the state machine and agent orchestration. Each agent is a node; escalation, retry, and early-exit paths are edges; shared state carries full incident context across every transition.
Claude 3.5 Sonnet for the Monitor, Diagnosis, and Explanation agents - every place where language reasoning drives the output.
LangSmith for distributed tracing - every agent transition, LLM call, tool invocation, and state mutation captured as nested spans with custom metadata. Every incident trace is findable by incident ID.
FastAPI for the webhook server that receives Airflow
on_failure_callbackevents.SQLite for persistence across seven tables - pipeline runs, task states, audit log, schema registry, incident patterns, outcome metrics, and agent thoughts.
Streamlit for the live operations dashboard including thought stream and watcher panel.
The architecture supports both the built-in pipeline simulator and a real Airflow 2.7+ instance. Set USE_AIRFLOW=true, point WATCHER_DAG_IDS at your actual DAGs, and the watcher picks up real failures automatically.
What this means for the data engineer
The teams I’ve managed didn’t have a monitoring problem. They had a cognitive load problem. Detection, diagnosis, coordination, remediation, verification, and stakeholder communication of incidents consumed engineering time that should have been going toward building.
Pipeline Sentinel automates that load end to end. The engineer’s job shifts from responding to incidents to designing the system that responds - defining the dependency graph, the escalation rules, the pattern memory thresholds, the governance decisions. That’s more interesting work, and it scales in a way that manual triage never will.
The question isn’t whether data teams will adopt autonomous pipeline management. It’s which teams will have built the judgment and the institutional knowledge to do it well by the time it becomes table stakes.
The code is on GitHub. If you’re thinking through what agentic infrastructure looks like for your data platform - whether to build, buy, or combine both - I’d welcome the conversation.
#DataEngineering #AIAgents #AgenticAI #DataPipelines #DataObservability #LangGraph #AnalyticsEngineering #MLOps #GenerativeAI #SelfHealingPipelines