
The Semantic Layer: Define it once. Mean it everywhere.
How to design a semantic model your whole organization actually agrees on.

Most semantic layer projects fail before a single line of YAML is written. Not because of the tooling. Not because of the infrastructure. Because the organization never agreed on what “revenue” means.
The technical implementation of a semantic model is, frankly, the easier part. The harder part is the conversation you have to have with Finance, Sales, Marketing, and Product before you open your IDE. Get that conversation right and the model almost writes itself. Skip it and you will spend the next twelve months maintaining five versions of the same metric, each subtly wrong in a different way.
This is the practical guide to that conversation - and to the design decisions that follow it. We cover the building blocks of a semantic model, the naming conventions that prevent future drift, and the governance process that makes definitions stick.
Start before the model: the discovery conversation
Before modeling anything, you need to understand how your organization actually uses data today - not how it thinks it does. This means interviewing the people closest to the metrics: Finance, Ops, Product, Marketing leads. Not the data team. The data team knows what the tables say. Business leads know what the numbers are supposed to mean.
The goal of this discovery phase is not to build a data dictionary. It is to surface the disagreements that already exist in your organization - so you can resolve them in the semantic model rather than embed them as hidden assumptions.
The discovery checklist : For each candidate metric: What is the business question this metric answers? Who owns the definition? What are the edge cases (refunds, trials, internal accounts, multi-currency)? Are there known variants already in production? Which source systems feed it - and do they agree?
This work is unglamorous and takes longer than expected. It is also the highest-leverage thing a data leader can do at the start of a semantic layer project. Start small and grow deliberately - pick the handful of KPIs that show up in every leadership meeting, like customer count, revenue, CAC, and retention, and define those first. These become your anchor metrics.
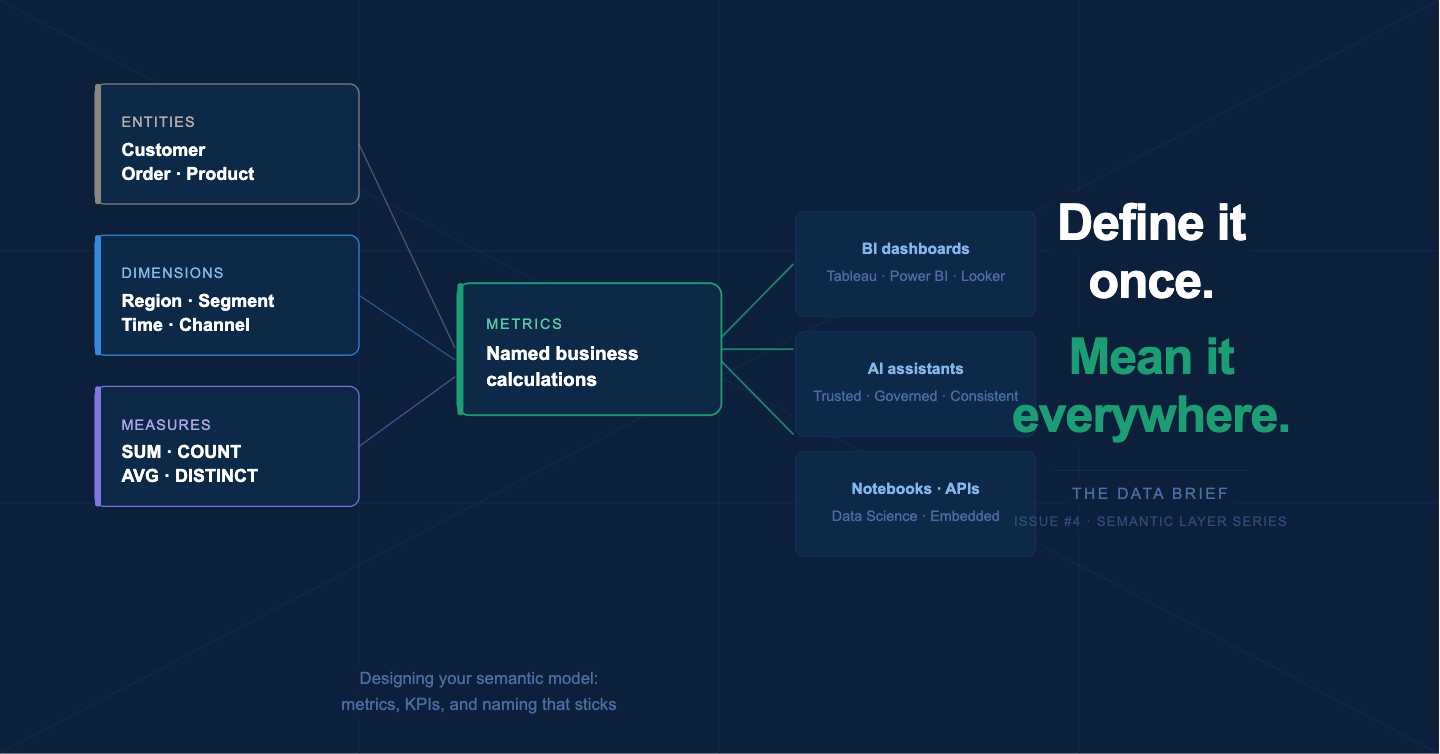
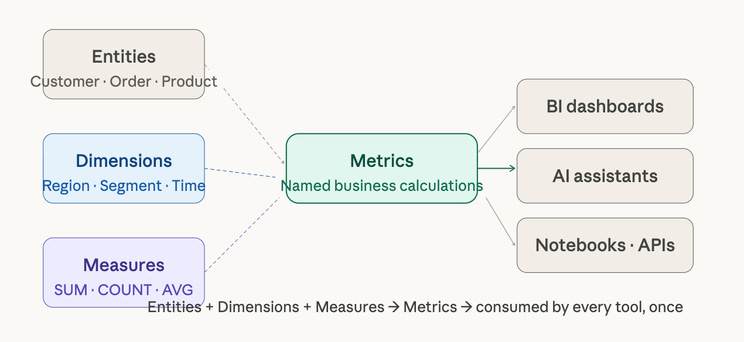
The four building blocks of every semantic model
Regardless of which tool you use - dbt MetricFlow, Snowflake Semantic Views, Cube, or Looker LookML - every semantic model is assembled from the same four elements. Understanding these before picking a tool prevents you from designing for the tool rather than for the business.
Entities: Entities are the core business objects your organization reasons about: Customer, Order, Product, Account, Campaign. They map to physical tables but carry business meaning - they define what a “row” represents in human terms. An entity called Customer should correspond exactly to how your organization defines a customer, including whether trials count, whether churned customers are included, and how duplicates across systems are resolved.
Dimensions: Dimensions are the attributes you use to slice and filter metrics - Region, Product Category, Customer Segment, Time Period. Dimensions are non-aggregatable attributes that determine the level of aggregation - region, product category, time period. The key design decision for dimensions is granularity: a Region dimension that works for a US-only business will break the moment you expand internationally unless you planned for country, state, and territory hierarchies upfront.
Measures: Measures are the raw aggregatable values that metrics are built from - SUM(order_amount), COUNT(DISTINCT customer_id), AVG(session_duration). Measures live close to the data. Measures must be expressed using aggregate functions and can reference base fields in the source data or earlier-defined dimensions. A good measure definition is specific enough to be unambiguous but general enough to support multiple derived metrics.
Metrics: Metrics are named, governed business calculations built on top of measures. Revenue, Customer Acquisition Cost, Monthly Active Users, Net Revenue Retention. This is where organizational alignment matters most - and where most semantic layer projects run into trouble. A metric is not just a formula. It is a formula plus a business decision about what to include, what to exclude, and which edge cases to handle.
The metric definition trap. The most common mistake is confusing a measure with a metric. SUM(order_amount) is a measure. “Revenue” is a metric - and revenue means: gross or net? Does it include tax? Does it include refunds? Does it exclude internal test orders? Does it use booking date or recognition date? Each of those is a business decision, not a technical one. Your semantic model enforces whichever decision you make - so make it explicitly, not accidentally.
Naming conventions that prevent future drift
Naming is where semantic models quietly fall apart over time. A metric named revenue gets a companion called net_revenue, then adjusted_revenue, then revenue_v2. Within eighteen months you have five revenue metrics and nobody remembers why.
Good naming conventions do two things: they make the model self-documenting, and they make metric drift visible before it compounds. Here are the rules that work in practice.
Use snake_case consistently, everywhere : monthly_active_users, not MonthlyActiveUsers or MAU or monthly active users. Abbreviations are a major source of drift - MAU means Monthly Active Users to one team and Multi-Account Users to another. Spell it out.
Encode the aggregation type in the name : Prefix or suffix metrics with their aggregation: revenue_total, sessions_count, load_time_avg_ms. This prevents a consumer from applying a second SUM on top of an already-aggregated metric - a silent error that produces numbers twice as large as reality.
Name for the business question, not the calculation : The metric name should answer “what is this measuring” not “how is it calculated.” customer_acquisition_cost tells you what it is. total_marketing_spend_divided_by_new_customers tells you how it is calculated - which will change, making the name wrong. Business names age better than formula names.
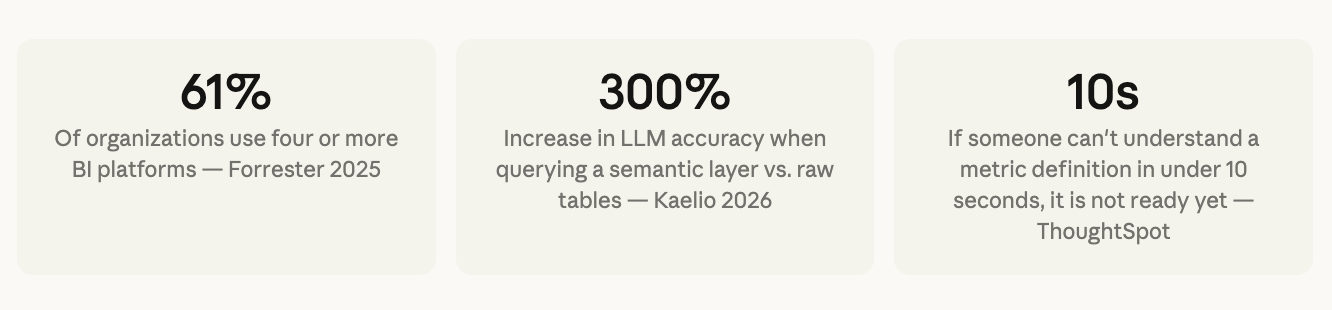
Every metric needs a plain-language description : If someone can’t understand a metric definition in under 10 seconds, it is not ready yet. Write the description as if explaining to a new Finance analyst on their first day: what does it measure, what does it exclude, and which team owns the definition.
Synonyms are a first-class citizen : Modern semantic tools - including Databricks Metric Views and Snowflake Semantic Views - support synonym definitions. Semantic metadata including synonyms travels with the metric, so when an AI assistant or a business user asks for “MRR,” “monthly recurring revenue,” or “monthly revenue,” they all resolve to the same governed definition. Build your synonym list during discovery, not as an afterthought.
Time intelligence: the dimension nobody designs properly
Time is the most universal dimension in any semantic model and the one most frequently under-designed. Most teams add a date dimension and consider it done. Then a Finance stakeholder asks for “revenue this fiscal quarter” and the model has no concept of a fiscal calendar. Then someone asks for “week-over-week growth” and the model has no rolling window logic. Then the company expands internationally and time zones break everything.
Time intelligence is not a column - it is a set of deliberate design decisions made early, because adding them retroactively is expensive.
Time intelligence checklist before you build. Does your organization use fiscal or calendar quarters? Which time zones matter - user-local, server, or UTC? Do you need rolling windows (7-day, 28-day, 90-day)? Do you need period-over-period comparisons (WoW, MoM, YoY)? Do you need “as of” reporting for point-in-time analysis? Each yes adds design requirements. Answer these questions before the first metric is defined.
Business rules like fiscal calendars, currency conversions, and custom period calculations belong in the semantic layer - not in every downstream dashboard that needs them. If your organization runs on a 4-4-5 fiscal calendar, that logic lives once in the semantic model and is inherited by every metric that uses it. This is one of the highest-value things a well-designed semantic model does - and one of the hardest things to retrofit once dashboards are in production.
The governance process that makes definitions stick
Designing the model is the first problem. Keeping it from drifting is the ongoing one. Ontology drift - where business definitions and semantic model implementations gradually diverge over time - leads to inconsistent metrics and reduced trust in analytical outputs. This challenge gets worse in dynamic business environments where processes, organizational structures, and strategic priorities evolve rapidly.
The solution is not documentation. Documentation goes stale. The solution is a lightweight governance process with clear ownership.
“Decide who can propose new metrics, who approves changes, and how version control works. This prevents metric drift, where definitions slowly change and teams unknowingly fall out of sync again.”
— ThoughtSpot, Semantic Layer: The Key to Trusted Analytics and AI
In practice, this means three things. First, every metric has a named owner - not a team, a person. That person is accountable for the definition being current and for approving changes. Second, changes to metric definitions go through a lightweight review process - not a committee, but at minimum a pull request that a second person approves. If your semantic model lives in YAML in a Git repository (as it should), this is already built in. Third, you maintain a metric change log - a record of what changed, when, and why. When an executive asks why the revenue number changed between last Tuesday and this Tuesday, you want to be able to answer that question in sixty seconds.
Gartner projects that by 2027, organizations prioritizing semantics in AI-ready data will increase GenAI model accuracy by up to 80% and reduce costs by up to 60%. The governance process is not overhead - it is the mechanism that makes that accuracy durable.
What a well-designed metric definition actually looks like
Here is a concrete example using dbt MetricFlow YAML - the syntax most analytics engineers will encounter in 2026. The same concepts apply in Snowflake Semantic Views, Cube schema files, and LookML, with different syntax.
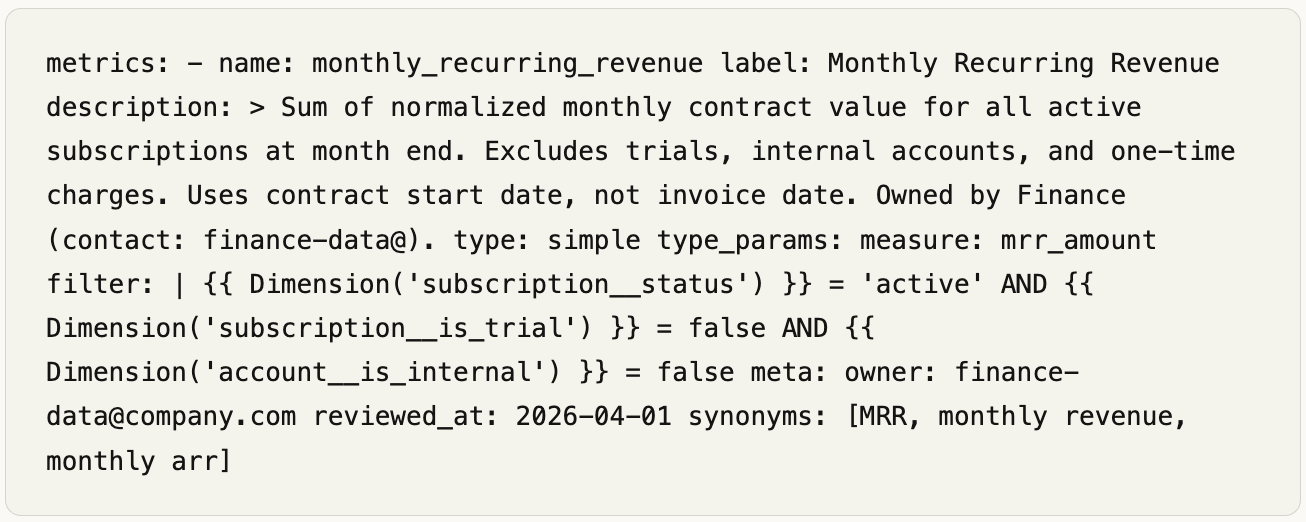
Notice what this definition contains beyond the formula: a plain-language description that explains edge cases, an explicit filter that encodes the business rules, a named owner, a review date, and synonyms for AI and search resolution. This is what a production-ready metric definition looks like. A formula alone is not a definition - it is a starting point.
Design before you build. The most important output of a semantic model design phase is not the YAML files - it is the organizational agreements those files encode. The metric definitions, naming standards, time intelligence decisions, and governance process you put in place now will determine whether your semantic layer becomes a trusted foundation or an expensive source of new confusion. Next issue: the tool comparison - dbt, Cube, AtScale, and Looker assessed honestly, side by side, with no vendor influence.
#TheDataBrief #SemanticLayer #DataModeling #AnalyticsEngineering #DataStrategy#dbt #MetricLayer